Client
Project date
Role
Project link
Description
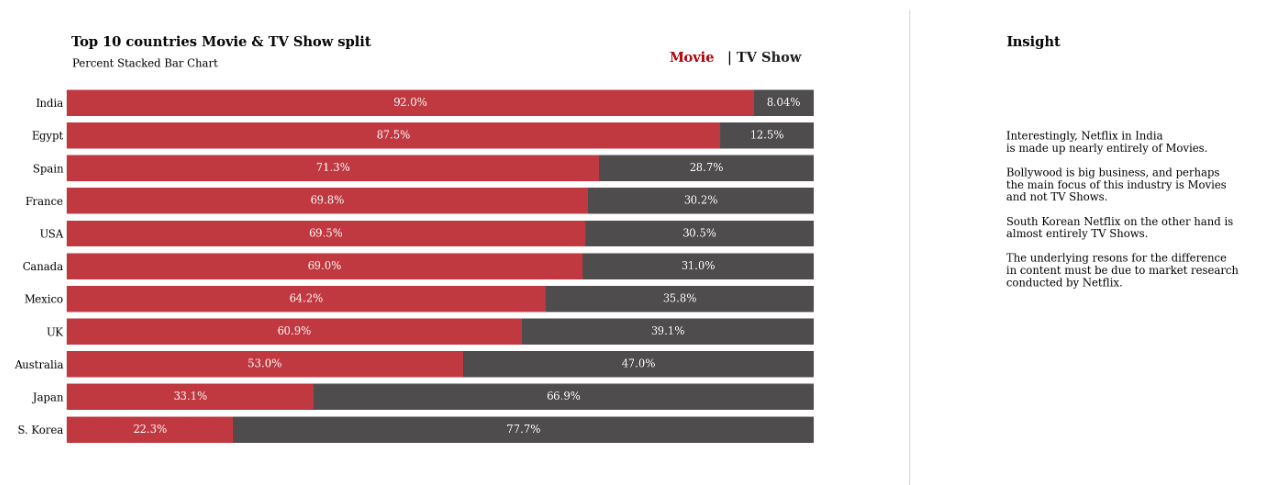
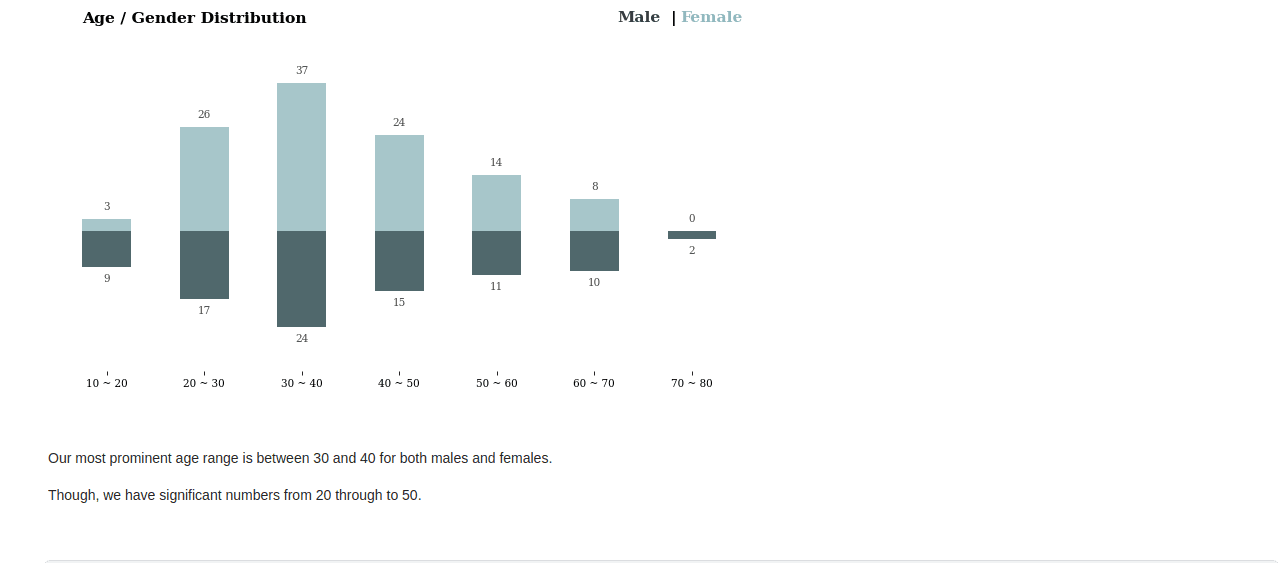
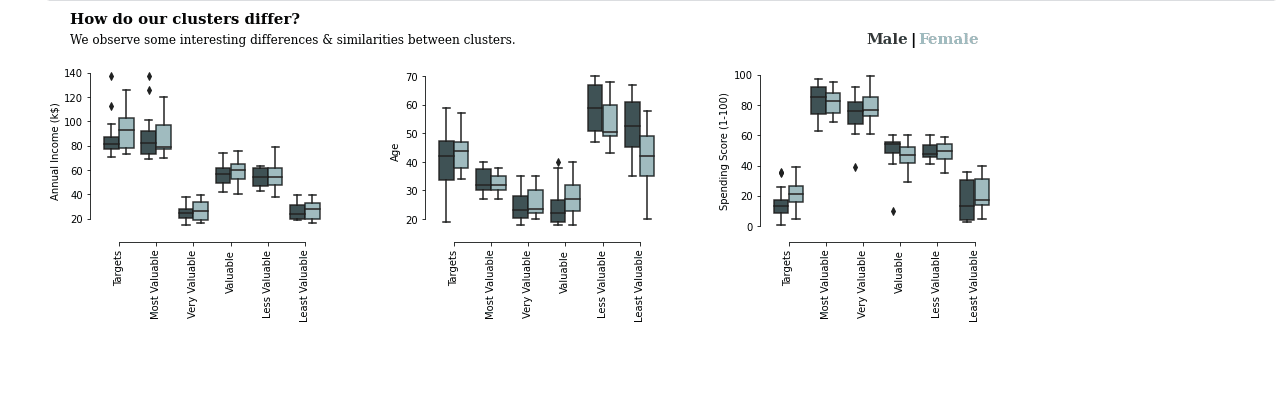
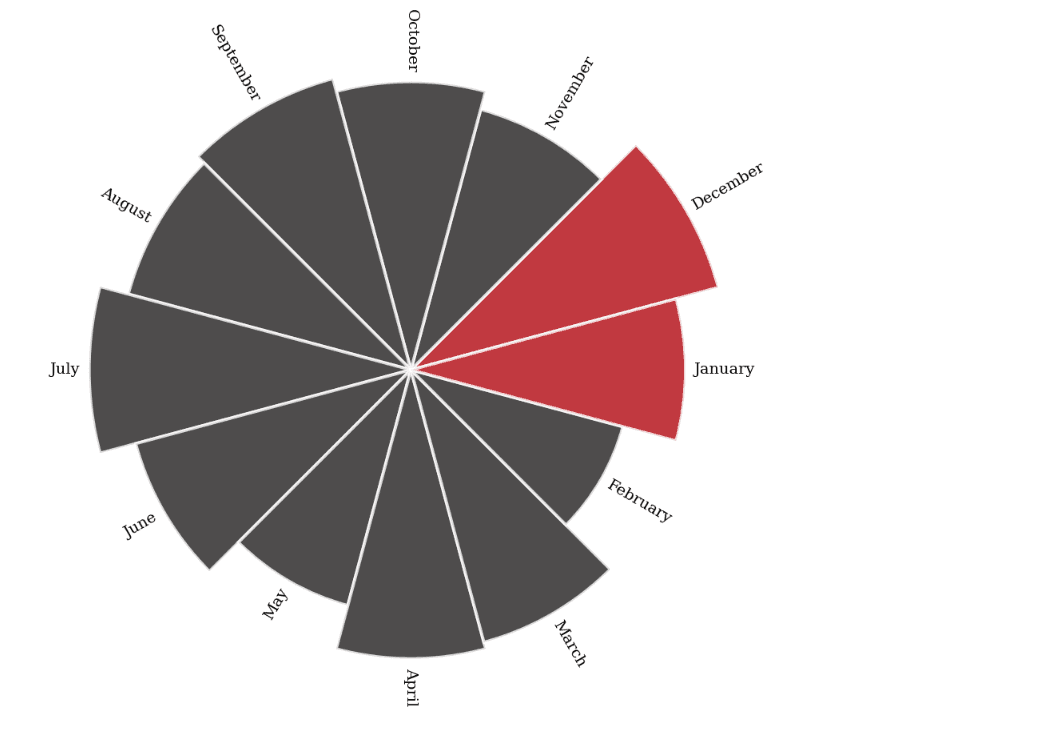
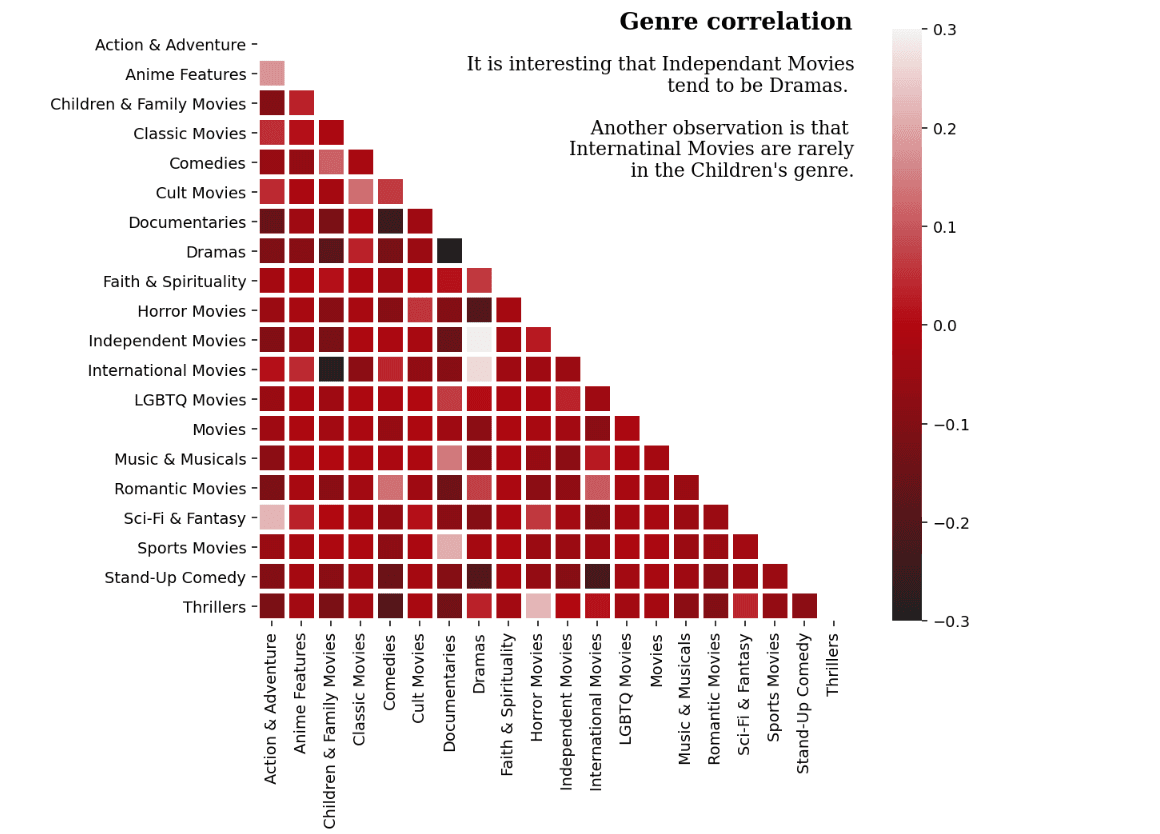
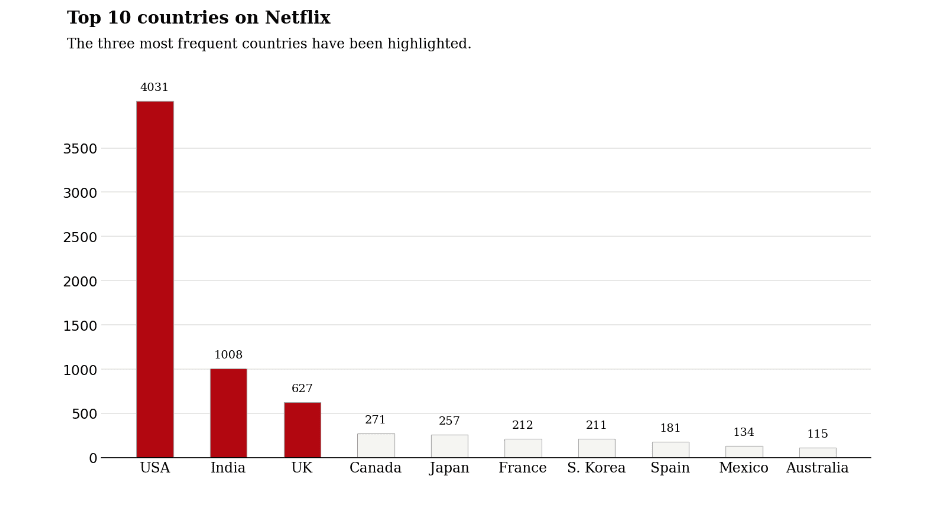
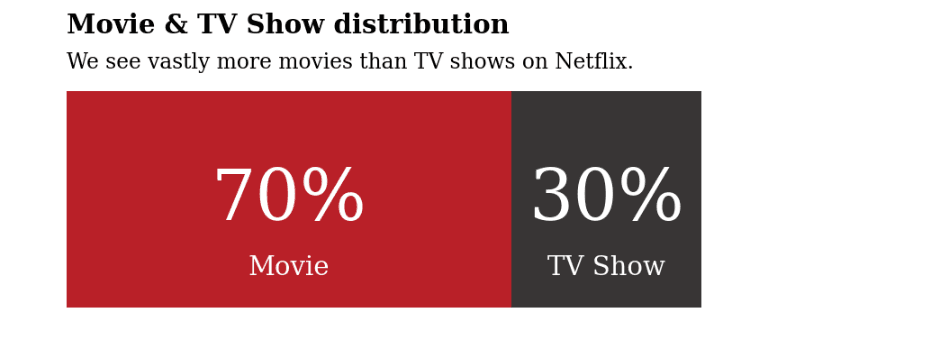
This project involved data visualization and analysis on Netflix dataset.
The brief started from raw, uneven data and an open question: what could be learned from it, and what would be reliable enough to act on.
Approach
01
Framed the question with the stakeholder, then audited the data available against it.
02
Cleaned, structured and engineered the inputs, documenting every transformation.
03
Built and compared candidate models in Power BI and Matplotlib, tuning the strongest.
04
Validated on held-out data and packaged the result with a written hand-off.
Stack
Gallery
Outcome
A reproducible pipeline that can be re-run on new data without rework.
Findings translated into plain-language recommendations for non-technical readers.
Documentation and code structured so another analyst can pick it up.